Businesses today face increasing pressure to deliver high-quality software products quickly and efficiently. Whether for startups or established enterprises, software projects must meet complex requirements, ensure robust performance, and satisfy ever-evolving customer expectations. As such, the key to consistent success in software delivery lies in the ability to leverage data to make informed decisions throughout the development lifecycle.
Gone are the days when project success was solely based on intuition, gut feeling, or the experience of a few key players. Today, data-driven software delivery is emerging as a game-changer, allowing businesses to predict project success by analyzing key metrics. These metrics serve as early indicators that can guide development teams, reduce risks, and provide the transparency needed to ensure the timely and successful delivery of software.
What Is Data-Driven Software Delivery?
Data-driven software delivery refers to the practice of using data to inform decisions throughout the software development lifecycle. It is an approach that emphasizes the importance of measuring performance, tracking progress, and predicting outcomes using key metrics rather than relying on subjective judgment.
In the context of software development, data-driven decisions help businesses identify patterns, anticipate challenges, and optimize their workflows to increase efficiency, reduce costs, and improve the quality of the end product.
By focusing on measurable outcomes at every stage of the software delivery process, businesses can ensure that they are not only meeting deadlines but also delivering software that meets customer needs and expectations. This approach helps track performance in real-time, making it easier to adjust course when necessary.
Why Is Data-Driven Software Delivery Important?
The importance of data-driven software delivery cannot be overstated. Here are some of the key reasons why data-driven delivery is becoming a cornerstone for modern businesses:
- Improved Visibility and Transparency
Data-driven delivery provides teams with clear visibility into the progress of the project. With real-time metrics, stakeholders at all levels can gain insight into potential roadblocks, bottlenecks, and risks. This transparency is invaluable for making informed decisions about resource allocation, scheduling, and prioritization. - Predictability and Risk Mitigation
By tracking key performance indicators (KPIs), businesses can predict the success of a project long before the product is released. This allows teams to take proactive measures to mitigate risks, whether they involve scope creep, resource shortages, or technical challenges. Predictive analytics can help identify risks early, allowing businesses to make adjustments that can prevent delays or failures. - Continuous Improvement
Data-driven delivery encourages continuous learning. By consistently monitoring and analyzing the data, teams can uncover areas for improvement and optimize their processes over time. Whether it’s improving code quality, shortening delivery cycles, or reducing technical debt, data enables teams to evolve and improve continuously. - Increased Collaboration and Accountability
When everyone on the team has access to real-time data, collaboration becomes more focused and aligned. Data-driven delivery fosters a culture of accountability, where every team member understands the importance of their contributions and can see how their work impacts the overall project. - Faster Time-to-Market
By optimizing processes based on data insights, businesses can accelerate the software delivery process. Faster delivery cycles mean that products get to market quicker, allowing businesses to respond to market demands, customer needs, and competitor moves more effectively.
Key Metrics That Predict Project Success
To make data-driven decisions and predict project success, businesses must rely on a variety of metrics that cover every aspect of the software development lifecycle. These metrics can be categorized into five main areas: planning and estimation, development and testing, deployment, performance, and post-release monitoring. Below are the key metrics that every software delivery team should track to improve their chances of success.
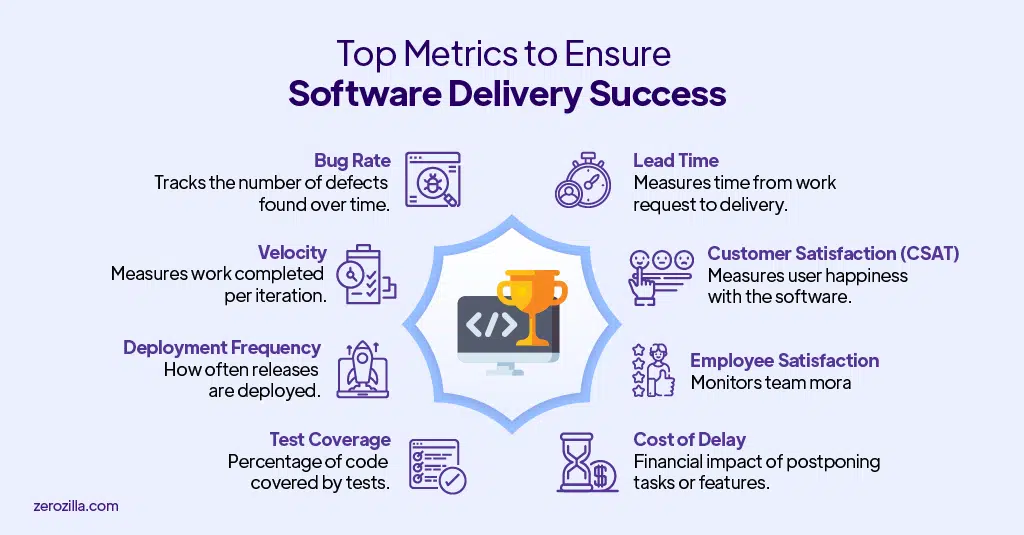
1. Velocity
Velocity is a measure of the amount of work completed by a development team during a specific period, often measured in story points or tasks. This metric helps teams gauge how efficiently they are working and how much they can accomplish within a given sprint or iteration.
Why It’s Important:
- Predicts how much work the team can handle in upcoming sprints.
- Helps identify if the team is on track to meet deadlines.
- Provides insight into whether the team needs additional resources or support.
By tracking velocity, businesses can determine whether they need to adjust their plans, allocate additional resources, or refine their development processes to achieve greater efficiency.
2. Lead Time and Cycle Time
Lead time and cycle time are key metrics for service-based companies, impacting client retention and trust. Lead time refers to the time taken from the moment a feature is requested or the work is initiated until it is completed and ready for release. Cycle time is the time taken for a specific work item to move from one stage to another, such as from development to testing.
Why It’s Important:
- Lead Time helps forecast how long it will take to deliver the final product.
- Cycle Time helps identify inefficiencies in the development process and can help optimize workflows.
By reducing cycle time and improving lead time, businesses can accelerate software delivery, minimize delays, and improve customer satisfaction.
3. Bug Rate and Defect Density
Bug rate refers to the number of defects or issues reported during a specific period. Defect density is the number of defects per unit of code, such as per 1,000 lines of code.
Why It’s Important:
- High bug rates or defect density often indicate poor code quality or inadequate software testing.
- Monitoring bug rates helps ensure that teams are addressing issues promptly and efficiently.
- QA is key to success, and bug rate monitoring is crucial for customer acceptance. A high bug rate can lead to poor user experience
Tracking bug rates and defect density allows businesses to improve software quality by identifying and addressing defects early in the development process, which helps reduce the cost of fixing bugs after deployment.
4. Test Coverage
Test coverage refers to the percentage of code or features tested during the development process. It’s an indicator of how well the system is being qualified through automated tests.
Why It’s Important:
- Higher test coverage improves confidence in the software’s stability and performance.
- Ensures that critical functionalities are thoroughly tested before release.
- Ensures core conditional logic completeness and accuracy.
- Ensures unexpected corner cases are being handled by the software.
- Helps optimize and factorize the code to achieve higher performance.
By measuring test coverage, businesses can identify areas of the codebase that need more software testing, thus ensuring better quality and fewer issues during deployment.
5. Deployment Frequency and Deployment Lead Time
Deployment frequency measures how often the development team is releasing new features, updates, or bug fixes. Deployment lead time is the time it takes from the moment code is committed until it is deployed to production.
Why It’s Important:
- High deployment frequency allows for faster updates and quicker responses to customer needs.
- Short deployment lead time means quicker feedback loops, which is crucial for iterative development.
- Higher lead time indicates an error-prone manual deployment process.
- Lower lead time indicates high-level deployment automation and higher trust.
By optimizing deployment frequency and deployment lead time, businesses can improve time-to-market, ensure the software is always up to date, and address issues or new requirements promptly.
6. Customer Satisfaction (CSAT) and Net Promoter Score (NPS)
These metrics gauge customer feedback and satisfaction with the software. CSAT typically involves direct surveys asking customers to rate their satisfaction, while NPS measures customer loyalty by asking how likely they are to recommend the product.
Why It’s Important:
- Direct customer feedback helps ensure the product meets user expectations.
- High NPS and CSAT scores indicate product-market fit and customer satisfaction, which are key indicators of long-term success.
CSAT and NPS provide businesses with valuable feedback on customer sentiment, helping identify areas for improvement and ensuring products meet user expectations. Leading SaaS unicorns rely on these metrics to drive business strategies and maintain customer loyalty.
7. Cost of Delay (CoD)
Cost of Delay refers to the economic impact of delaying a particular feature or release. It quantifies the financial implications of delays and helps prioritize features based on their potential return on investment.
Why It’s Important:
- CoD helps businesses understand the urgency of certain features or tasks.
- It helps prioritize high-value tasks that should be delivered first to maximize business value.
By tracking CoD, businesses can make data-driven decisions on what to prioritize and how to allocate resources, ensuring that the most impactful features are delivered first.
8. Employee Satisfaction and Burnout
Employee satisfaction metrics, such as surveys and feedback forms, measure how happy and engaged employees are. Burnout metrics track signs of overwork, stress, or dissatisfaction among the team.
Why It’s Important:
- Happy and motivated teams are more productive and less likely to make errors.
- Monitoring burnout helps prevent high turnover rates and the associated costs of losing experienced developers.
By tracking employee satisfaction and burnout, businesses can maintain a healthy work environment, which directly impacts software delivery outcomes.

Conclusion
In an era where software projects are increasingly complex and outcomes are unpredictable, data-driven software delivery offers businesses the ability to improve visibility, predict risks, and make informed decisions that lead to better project outcomes. By tracking the right metrics throughout the software development lifecycle, businesses can optimize their workflows, accelerate time-to-market, and ultimately deliver high-quality software that meets customer needs.
The key metrics outlined in this blog—ranging from velocity and lead time to test coverage and employee satisfaction—are vital indicators of success. By consistently measuring and analyzing these metrics, businesses can not only predict the success of their projects but also foster a culture of continuous improvement that leads to long-term success.
At Zerozilla, we specialize in leveraging data-driven approaches to deliver exceptional software development and testing services. Our expert team helps businesses utilize the power of metrics to predict project success and optimize the entire software delivery process. Reach out to us today to learn more about how we can help you transform your software delivery and achieve success faster.